Robust forecasting of energy savings based on real-world data
A market survey has revealed that while railway undertakings (RUs) are very interested in Driver Advisory Systems (DAS), they remain reluctant to invest in this technology [1]. The main reason cited by many of the RUs is a lack of robust data about the energy savings which they can expect to achieve. Now DB Cargo, DB Analytics, Knorr-Bremse and consulting firm Berg, Lund & Company (BLC) have developed a model that uses the savings achieved by DB Cargo with the LEADER Driver Advisory System to reliably extrapolate the potential savings for third-party RUs in the rail freight sector. This should allow RUs to put together a robust, bespoke business case for investing in Driver Advisory technology.
Contact
80809 München
Deutschland - Germany
carina.smid@knorr-bremse.com


Market penetration of Driver Advisory Systems still remains low
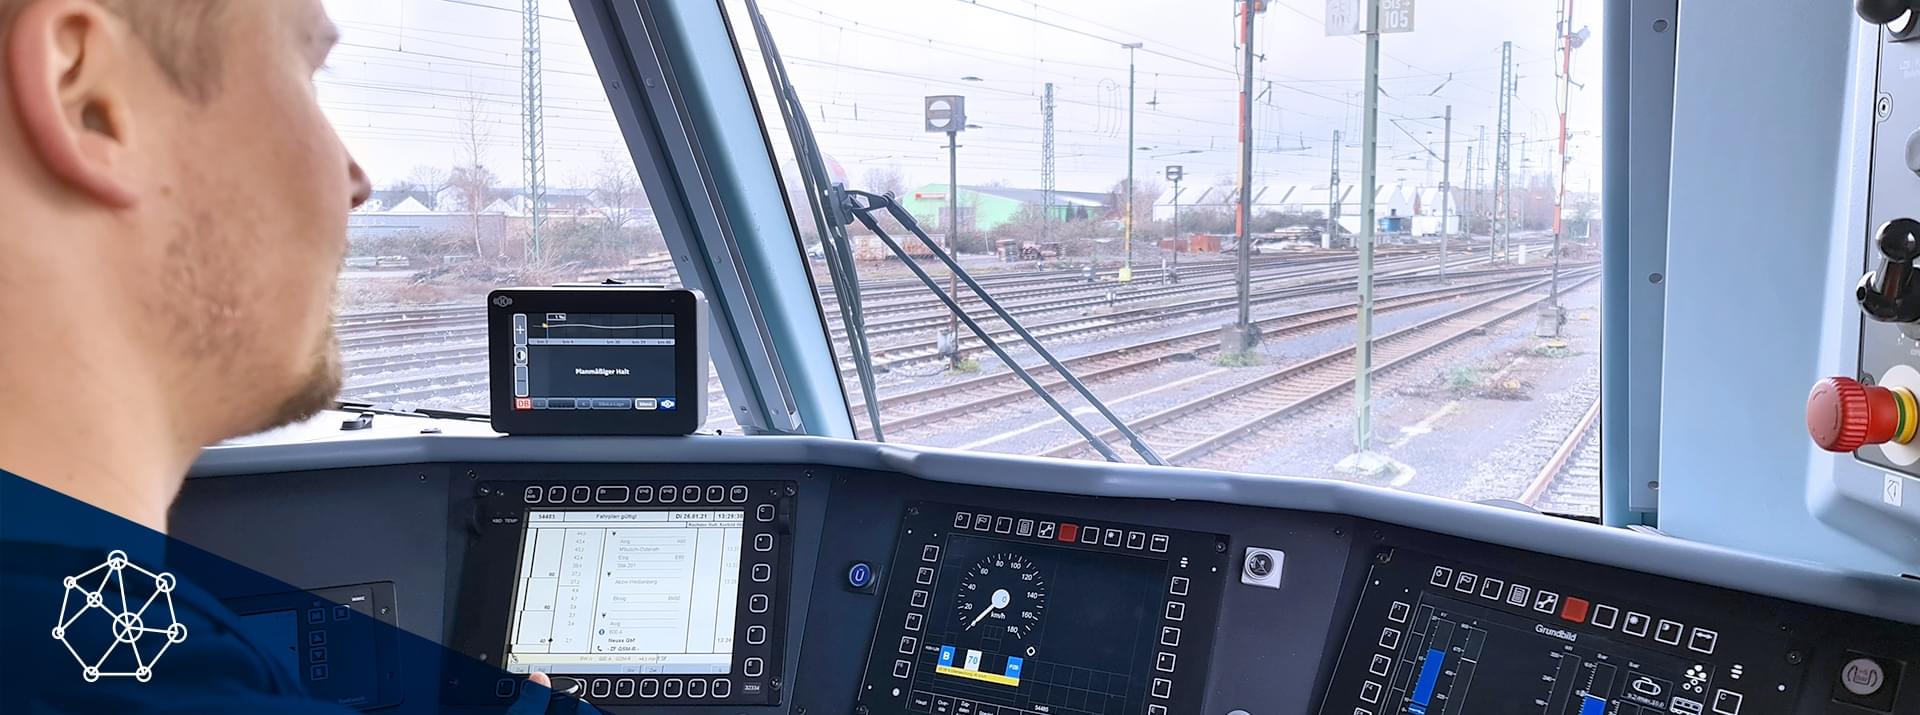
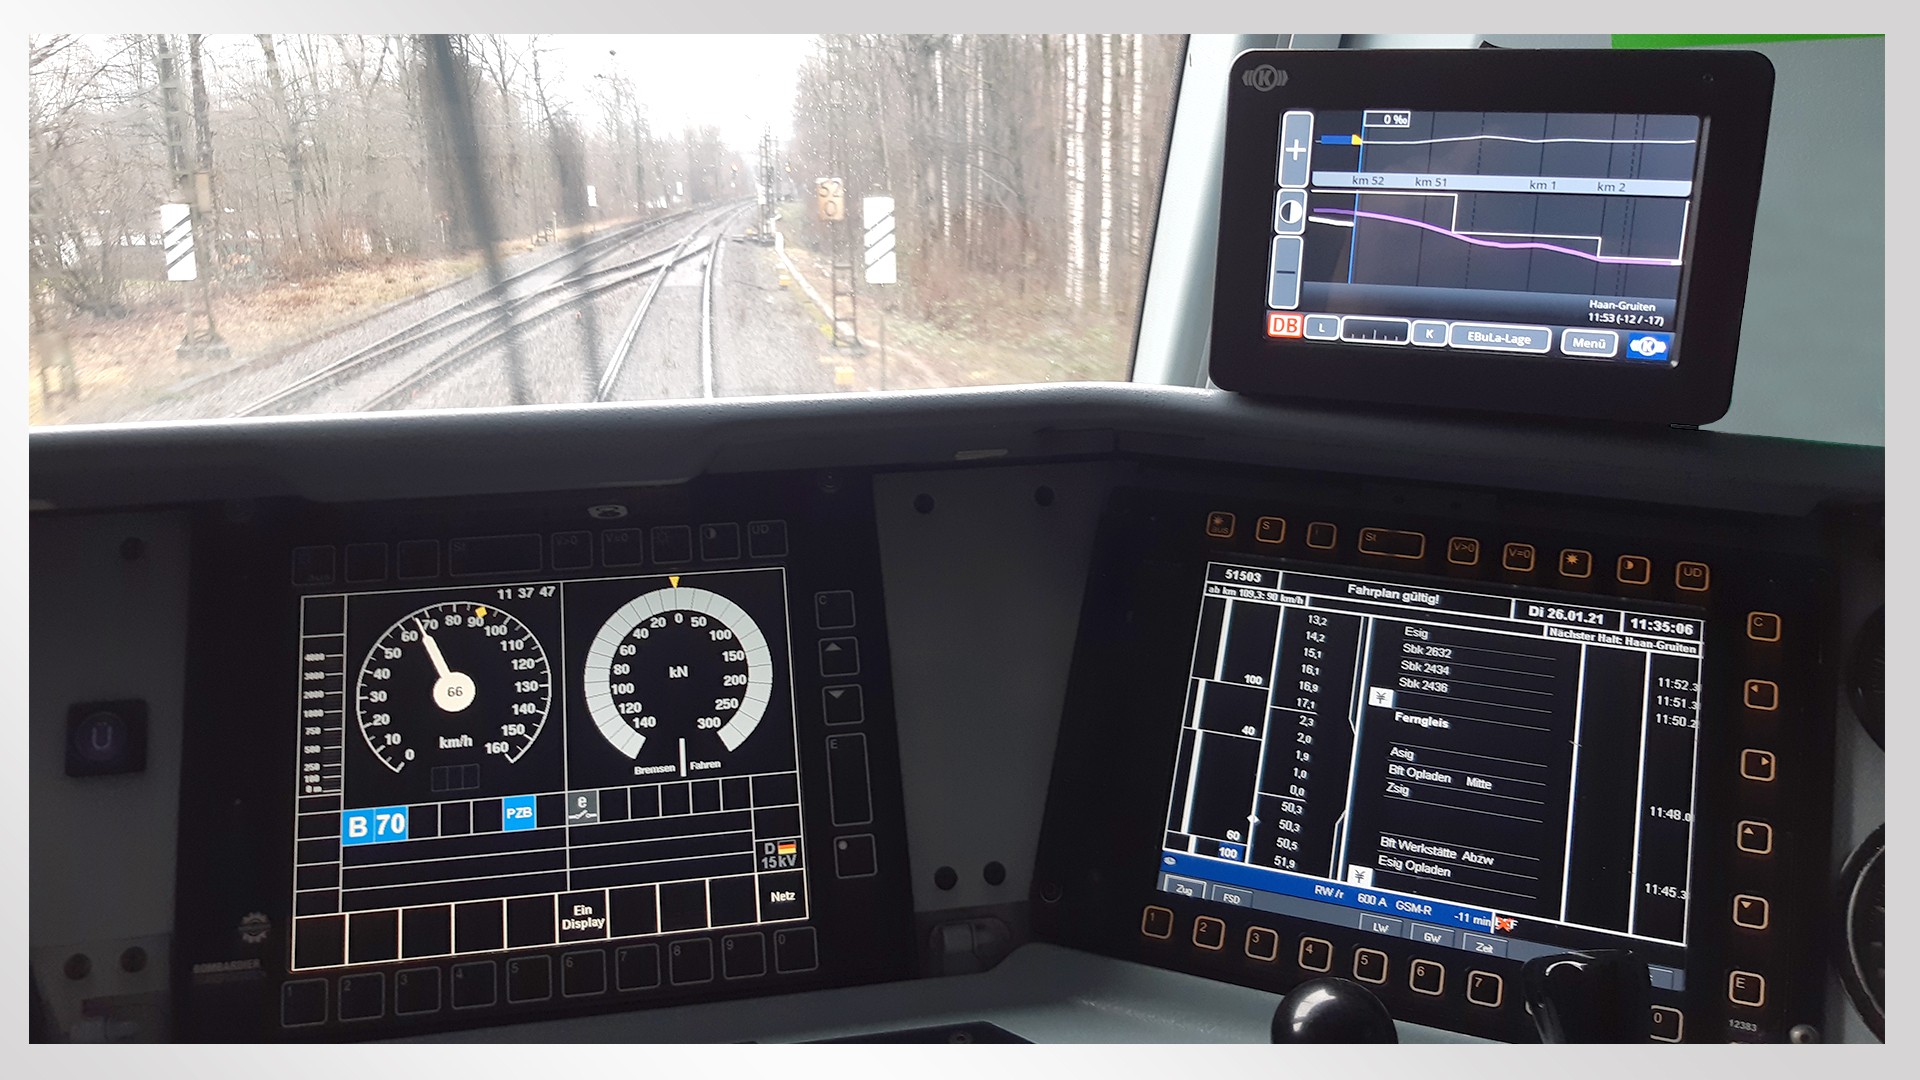
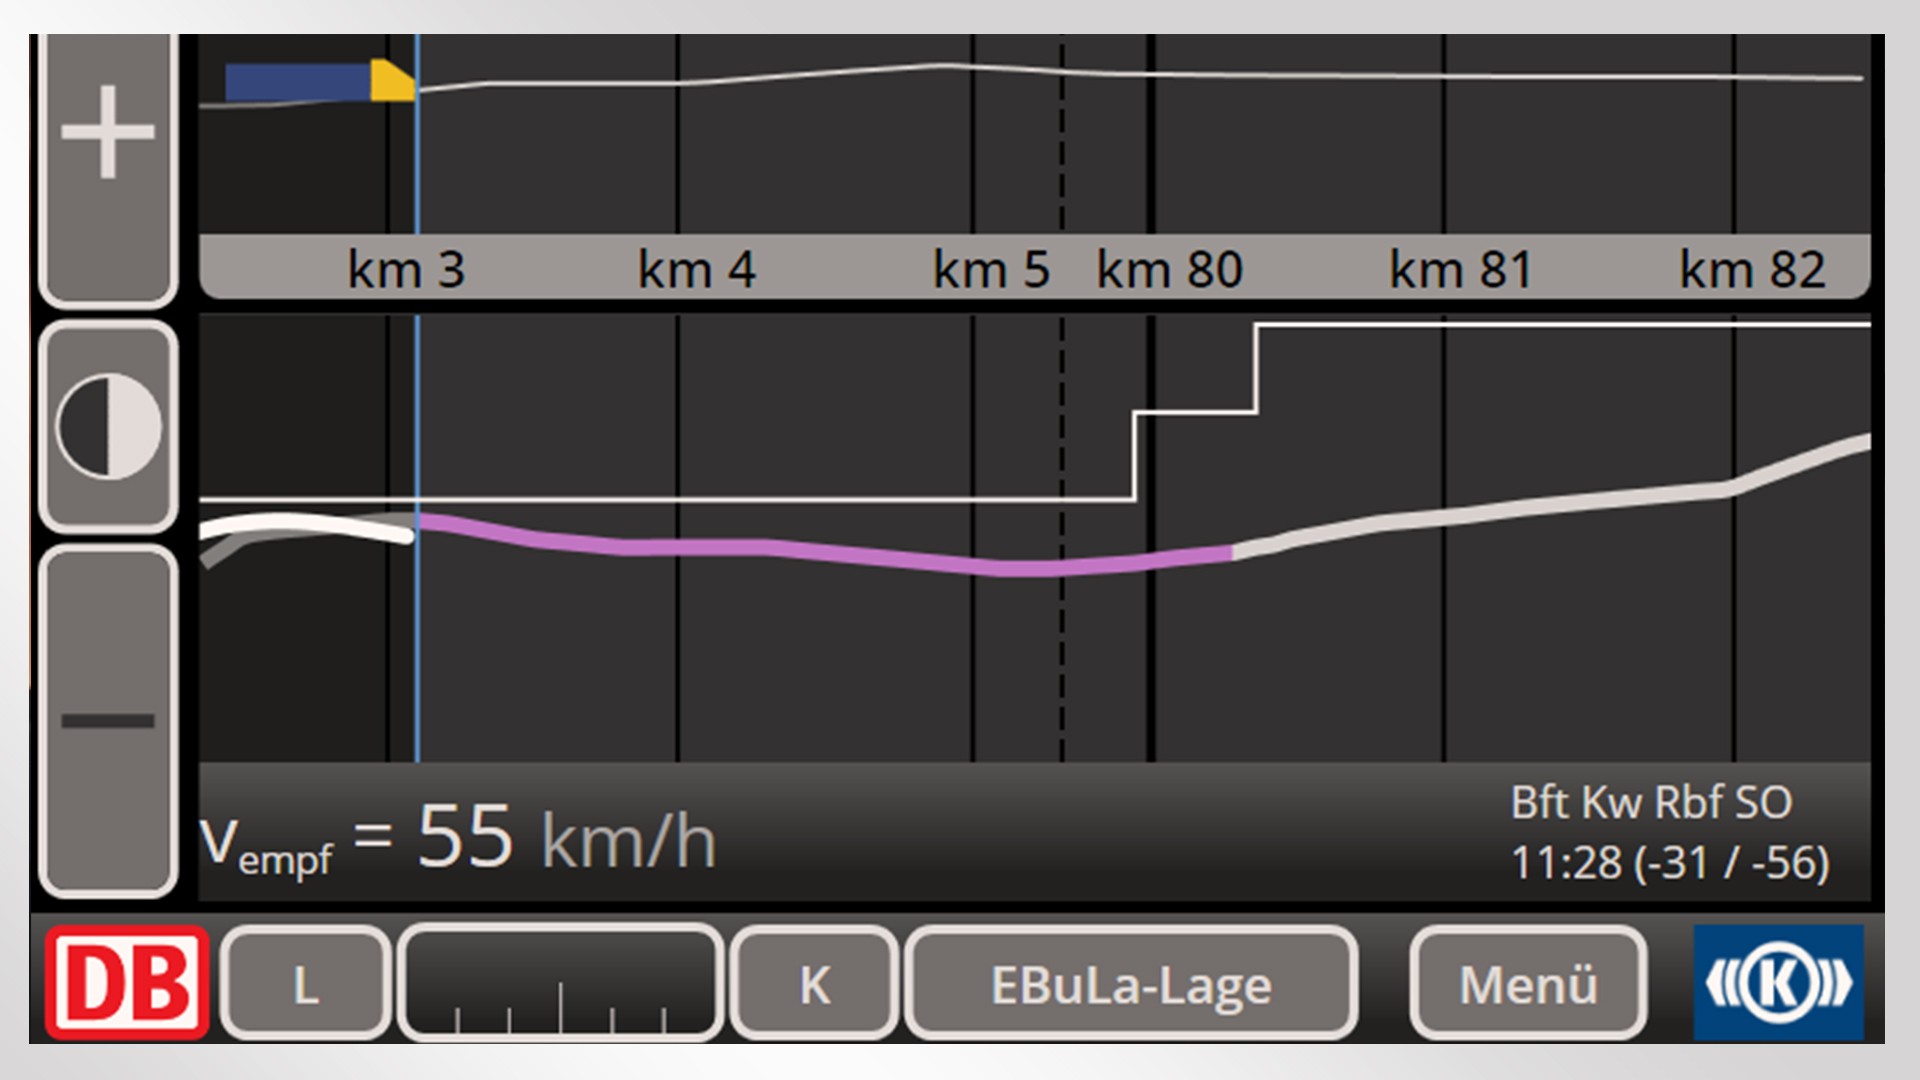
Driver Advisory Systems (DAS) are a proven means of reducing energy consumption in the rail freight sector. They provide train drivers with continuous or selective feedback on the most energy-efficient speeds to adopt while driving the train (see Figure 2). To make the necessary calculations, DAS use timetable information and train characteristics as well as topographic data and, where possible, dynamic (real-time) traffic information (e.g. to prevent conflicts with passenger trains sharing the same line) [2]. By modifying the train drivers’ behavior, DAS technology enables a smoother and more efficient rail traffic flow, thereby reducing the overall energy consumption.
DAS manufacturers often forecast potential energy savings of up to 10% or more. This translates into a cost saving of about EUR 150 for a single train journey, based on an average energy consumption of approx. 10,000 kWh. Depending on the size of the RU and the amount of energy consumed by its fleet, the potential savings could run to several million euros a year.
DB Cargo has pioneered the use of Driver Advisory Systems to reduce energy consumption. The company has been using Knorr-Bremse’s LEADER DAS for over four years, and the system is now installed in a fleet of around 650 locomotives of various classes. Feedback from the field indicates that train drivers have responded very positively to the system-generated suggestions, especially since the incorporation of dynamic traffic information (DB Netz AG’s “Green Functions”). This has led to a marked improvement in energy efficiency.

While other RUs also claim to be very interested in principle, they have so far been reluctant to invest in DAS technology. This is shown in a recent market survey carried out by Knorr-Bremse in conjunction with BLC to investigate the prevalence of DAS in the rail industry. It found that less than 30% of the companies that took part in the survey [1] had installed DAS technology in at least some of their locomotives. What are the reasons?
Energy-saving claims based on computer simulations
The companies that took part in the market survey cited the lack of concrete data about the energy savings which they could expect to achieve as one of the main reasons for their reluctance to invest. While almost all respondents said they were very interested in DAS technology [1], many RUs do not feel able to present the relevant decision-making bodies with a robust business case for making the necessary investment.
And indeed, most DAS manufacturers’ energy-saving claims are based on theoretical simulations. The savings are calculated by comparing the theoretical energy consumption figures that could be achieved by following driving recommendations generated by forecasting and simulation systems against current real-world energy consumption figures. By its very nature, however, this approach fails to adequately reflect several factors that are critically important in the real world. This is illustrated by the following three examples:
- The prioritization of passenger services has a major impact on freight train energy consumption: Even a single unscheduled stop to let a passenger train pass significantly increases the amount of energy consumed. It is difficult for simulations to realistically model these unscheduled stops based on the level of rail traffic at any given moment.
- In adverse weather conditions, factors such as reduced traction may require locomotive drivers to change the way they drive the train. The driver’s individual experience plays a key role in these situations, and it is very difficult to account for this experience in a simulation.
- In practice, driving recommendations may not always be available (e.g. for technical reasons due to GPS signal dropout) or, quite simply, may not be fully or properly implemented (e.g. because they are not accepted by the locomotive driver). Both of these factors reduce the energy savings that can be achieved and are difficult to incorporate realistically into a simulation without access to concrete empirical data.
The combination of these factors tends to result in simulations that overestimate the potential energy savings. On the other hand, the low market penetration of DAS technology means that real-world data is hard to come by. The resulting uncertainty makes it difficult to persuade management to invest in DAS.
The costs associated with DAS technology are naturally a significant factor in any decision regarding its adoption. In addition to the cost of buying and installing a DAS, its operation also requires access to data on, for example, track topography. Ideally, the system should also have access to dynamic traffic information [2] from the infrastructure operator. At present, network operators do not generally grant DAS operators access to the relevant information, meaning that RUs either have to purchase this input data or collect it themselves. Moreover, as key stakeholders, train drivers must be trained to operate the new system and provided with ongoing support, especially when they first start using it. Consequently, any uncertainty about the savings that a DAS can deliver will have a negative impact on the cost-benefit analysis, and this in turn will mean that it is swiftly rejected by management. As a result, despite manufacturers’ enthusiastic claims and a number of attractive funding opportunities (e.g. through Germany’s Energy and Climate Fund (EKF) [3]), DAS technology has yet to achieve the take-up that might be expected of a system offering an effective means of improving energy efficiency.
A robust forecasting model could help DAS make the breakthrough
Even with access to real-world DAS data, calculating the energy savings delivered by a DAS system is far from straightforward. A range of other factors – including attached load, weather conditions and track topography – have a significant impact on the amount of energy consumed during a particular train journey. It is not enough simply to compare journeys with and without DAS – the effect of the DAS must be carefully isolated using statistical methods. Working in close cooperation, DB Cargo, DB Analytics, Knorr-Bremse and the consulting firm Berg Lund & Company (BLC) successfully developed a system capable of doing this, and then used it to investigate the real-world impact of the LEADER Driver Advisory System. The aim was to determine the energy savings which can be achieved using DAS technology on the one hand, and on the other, to find out how the DB Cargo results can be extrapolated to other interested RUs.
To do this, a three-stage approach was adopted, as outlined in Figure 1. In stage one, the DB Cargo data was analyzed and a statistical method developed for reliably determining the energy savings attributable solely to the DAS. Once this method had been implemented, stage two investigated and sought to characterize the traffic-related and RU-specific factors (if any) that have a major influence on the achievable energy savings. These factors were used to generate a multidimensional energy saving matrix (ESM) that makes it possible to pragmatically extrapolate the energy savings which could realistically be achieved by other RUs in the rail freight sector. The extrapolation is performed in stage three, using the interested RU’s real-world traffic distribution in the previously identified dimensions. For the first time, this approach makes it possible to produce robust forecasts of the energy savings that could be achieved by third-party RUs, based on real-world data.
Stage 1 – Determining the energy savings achieved by the LEADER DAS
The first step involved the selection of representative reference routes throughout Germany, in conjunction with DB Analytics. The selected routes had to have a minimum length, and the LEADER DAS had to have been used a minimum number of times on these routes. The data for journeys with and without LEADER DAS technology on these routes was analyzed and used to generate comparison pairs. Journey comparability was ensured using parameters such as train number (= identical journeys/traffic), locomotive class (= identical technical characteristics of locomotives) and month (= to exclude seasonal effects). The comparison pairs thus comprise all possible combinations of a train journey with the LEADER DAS and a train journey without the LEADER DAS that meet the abovementioned criteria. The fact that all possible comparison combinations are represented means that the database can be regarded as statistically robust, even where the number of journeys on a given reference route is low.
Once the comparison pairs have been generated, it is possible to calculate the differences in specific energy consumption (in kWh per tonne kilometer) between journeys with and without the LEADER DAS. Using statistical test and estimation methods, both the existence and extent of a guaranteed energy saving can then be derived from the numerous figures for energy savings resulting from the comparison pairs. This makes it possible to establish a direct correlation between the deployment of the LEADER DAS and the achievement of an energy saving. The results are promising: depending on the train journey configuration, it is possible to demonstrate statistically significant energy savings of up to 10% or more.
Stage 2 – Generating a multidimensional energy saving matrix (ESM)
At this point, however, the results are not yet universally applicable to all RUs, since they are still too strongly influenced by the nature and characteristics of the specific RU and related operations. Out of a wide range of potential drivers, the following dimensions were identified as having the greatest influence on achievable energy savings, taking account of data availability and practicability:
- Age of locomotive class to be equipped with DAS
- Attached load during the journey
- Track topography
These three dimensions enable an even finer-grained analysis of the comparison pairs described above. Now, by generating a three-dimensional energy saving matrix, it is possible to show the relative energy savings that can be achieved for different clusters in the different dimensions.
Stage 3 – Extrapolating the results to interested RUs
Based on real-world data from DB Cargo and also taking the RU’s individual characteristics into account, robust forecasts of achievable energy savings can now be generated for RUs interested in using a DAS. It is simply a question of multiplying the ESM results by the frequency distribution of the individual RU’s journeys in the relevant dimensions/across the relevant clusters. To ensure that the data can be extrapolated without difficulty, it is even possible to reflect an individual RU’s unique characteristics by adjusting the ESM or its clustering. This allows interested RUs to determine the energy savings which they could expect to achieve on the basis of their individual operational distribution.
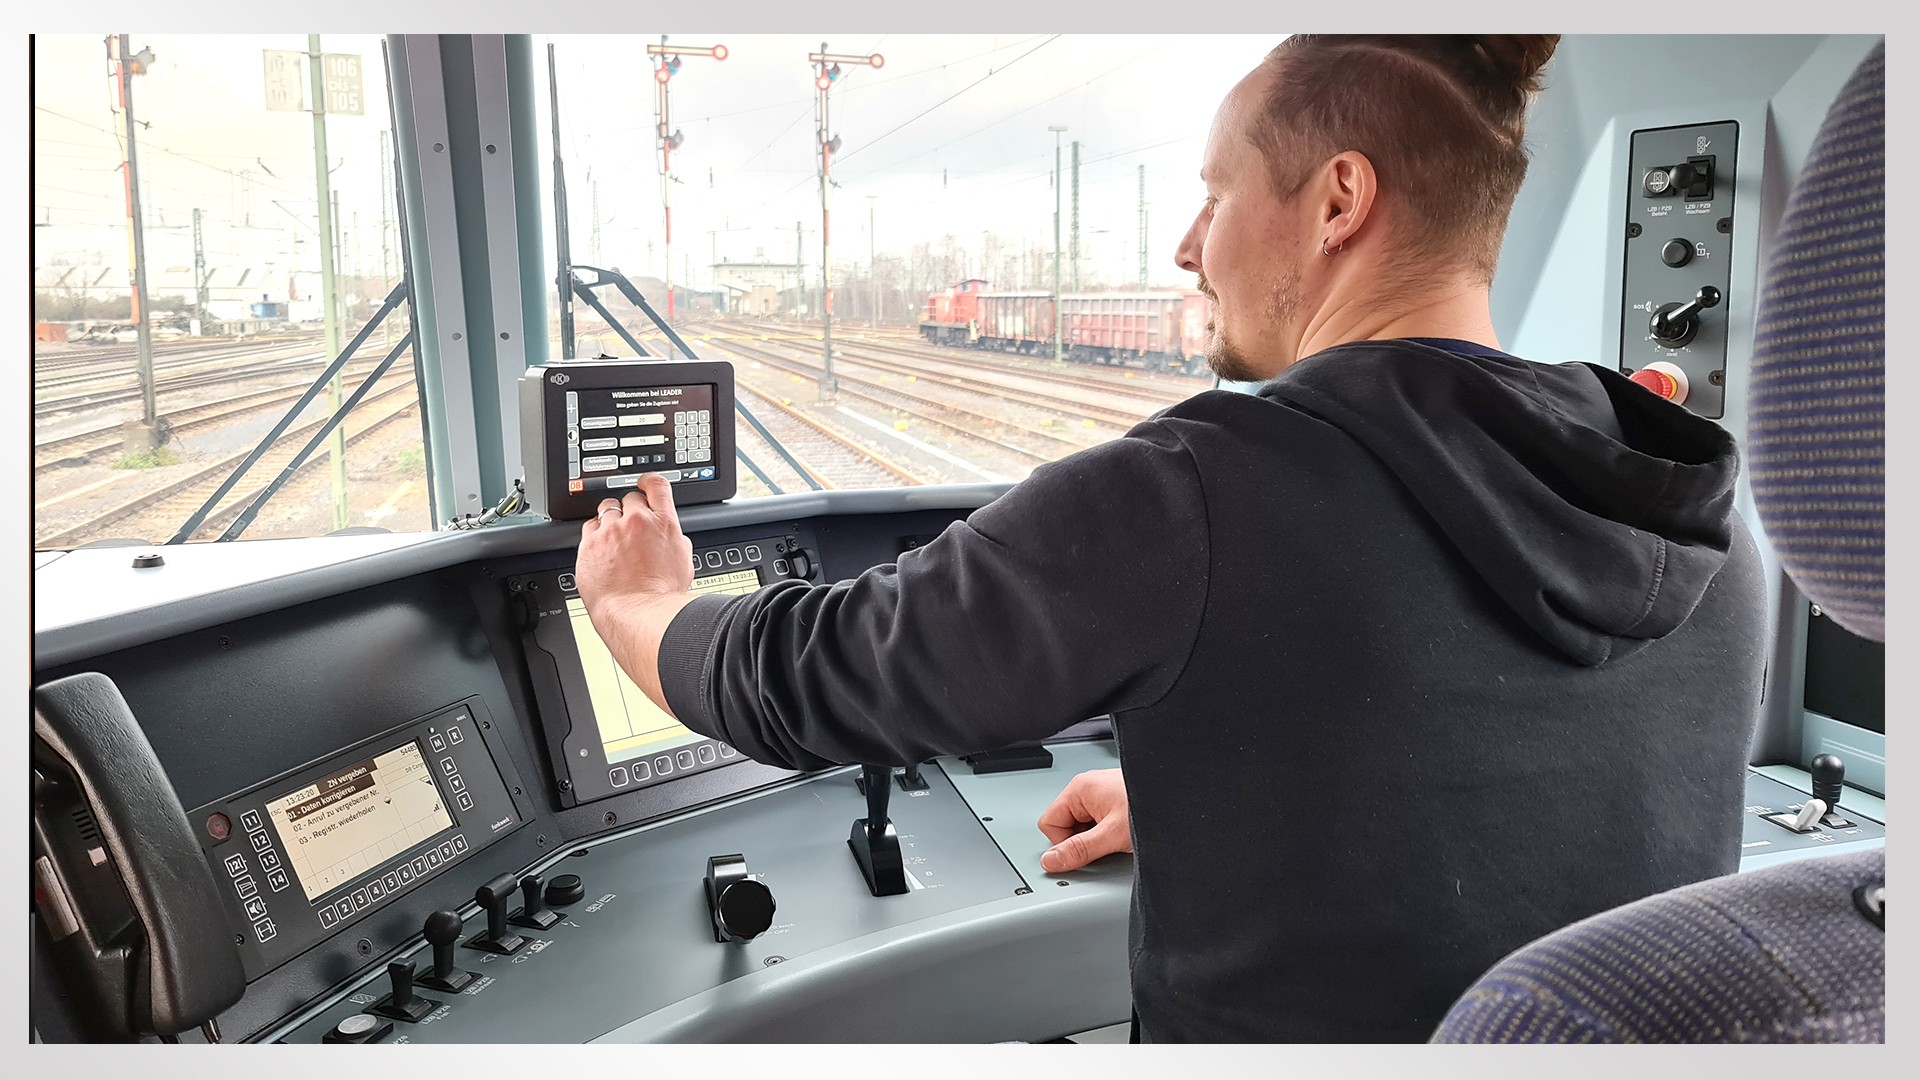
Key to the extent to which the results can be extrapolated remains the actual usage rate and acceptance of the DAS by the respective train drivers – after all, the train’s speed is ultimately determined by the driver, not the system (see Figure 3). The baseline data is drawn from the results achieved by the LEADER DAS in operation at DB Cargo, where the system is now well established and accepted. Change management is thus critical, particularly during the rollout phase – interested RUs should do everything in their power to guarantee the system’s success by ensuring that it is used to its full potential as soon as possible.

Making RU investment decisions easier by presenting robust business cases
The use of real-world data and the specific journey characteristics of interested RUs allows potential energy savings to be predicted with far greater accuracy. Rather than having to rely on generically simulated figures for energy savings, RU decision-makers now have access to extrapolations of real-world data that take their company’s individual characteristics into account. This means they can compare the cost of acquiring and operating a DAS against reliable forecasts of the savings they can expect to achieve through improved energy efficiency. Other factors specific to their RU can easily be incorporated into the forecasts at any time.
Now that they have a robust basis for their investment decisions, we hope that more and more RUs will use DAS to improve their energy efficiency, helping to make rail services an even more attractive, climate-friendly mode of transportation.
Authors: Dr. Martin Bernhardt, Jörg Schneider, Eva Lohmeier
References:
[1] 24 RUs and leasing companies from the passenger and freight sectors in 5 different countries took part in a recent market survey carried out by Knorr-Bremse and BLC in the fall of 2020. While almost all the companies in the survey described their interest in using Driver Advisory Systems as “high” or “very high”, only 7 RUs have actually installed DAS technology in at least part of their fleet.
[2] Access to live traffic information is key to successful DAS deployment. By improving route utilization and increasing acceptance among locomotive drivers, c-DAS (connected Driver Advisory System) technology enables significant energy efficiency gains.
[3] See:
https://www.bav.bund.de/DE/4_Foerderprogramme/93_Energieeffizienz_Eisenbahnverkehr/Energieeffizienz_Eisenbahnverkehr_node.html and Bernhardt (2019): Das Fördergeld liegt auf der Schiene, Bahn Manager 06/2019, pp. 12-15.