Scarce resources and the European Green Deal require that transportation should shift to rail. Many of the studies investigating the requisite improvements in capacity and service quality focus on the modernization and digitization of rail infrastructure, based on concepts such as DSTW, ETCS, ATO and Moving Block concepts. The following article describes the on-vehicle potential for increasing capacity by reducing braking-distance variance.
Contact
Carina Smid Marketing Rail
80809 München
Deutschland - Germany
carina.smid@knorr-bremse.com
Reproducible Braking Distance as the basis for reducing braking-distance variance
Rail-vehicle braking distances vary considerably as a result of accepted tolerances in vehicles’ technical characteristics (e.g. brake-pad friction coefficients, wheel diameters, degrees of efficiency) as well as environmental influences (z. B. precipitation, fallen leaves) that affect the adhesion between wheel and rail. If we succeed in minimizing or compensating for these influences, it will become possible to achieve statistically accurate braking distances (stop “on point”). Knorr-Bremse launched the RBD (Reproducible Braking Distance) program with precisely this objective in mind. As an adjunct to other, infrastructure-focused optimizations such as digital railway control centres and Automatic Train Operation (ATO), the purpose of this program is to make a vehicle-based contribution to improving both the capacity and operational quality of rail traffic. The RBD approach combines a new type of deceleration control function with an optimized, train-wide adhesion management function that also includes an improved wheel slide protection algorithm (Fig. 1).
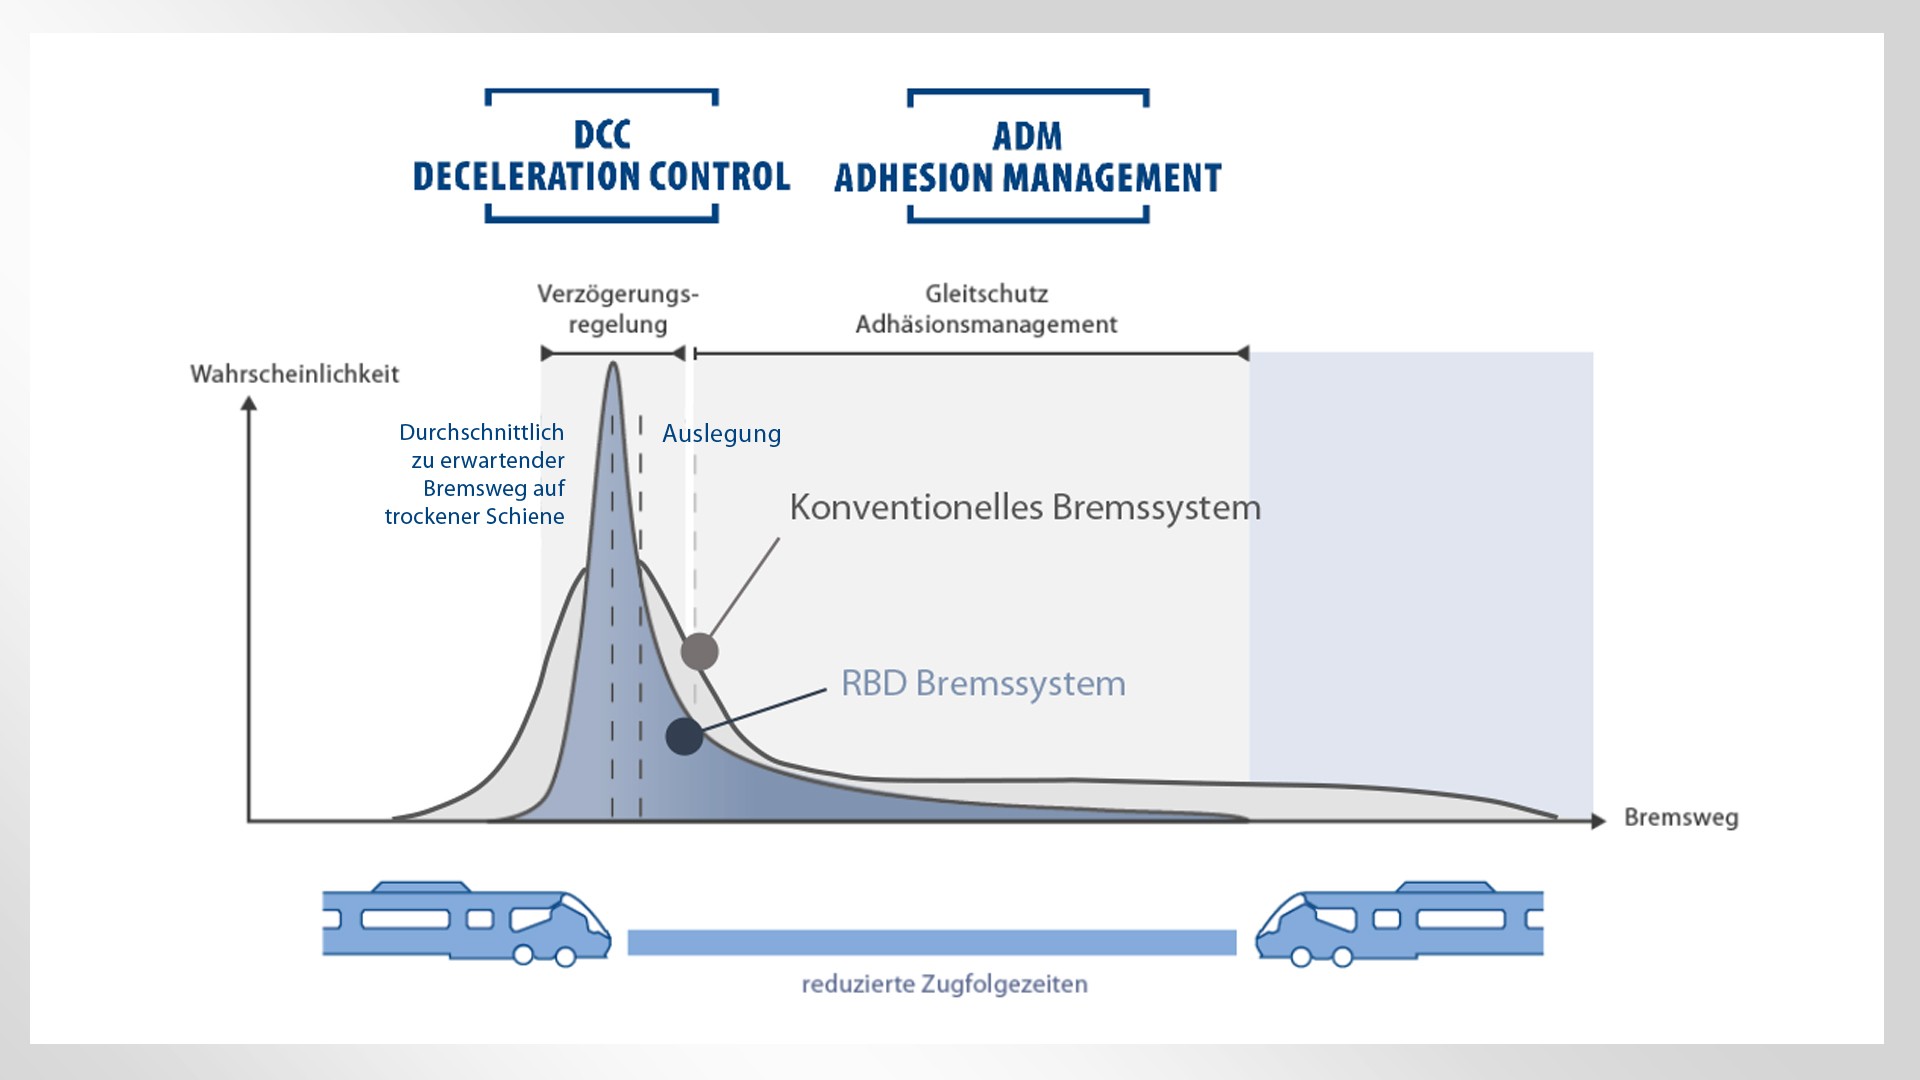
The use of these functions is improving our ability to predict and control the variability of braking distances, resulting in reproducible braking distances. The aim of the first building block in the RBD approach, the deceleration control function (DCC), is to make braking operations / stopping distances on dry rail as consistent – i.e. reproducible – as possible. By controlling / adjusting braking forces throughout the train, the actual deceleration achieved by the train is decoupled from variable operating conditions and the tolerances of the individual braking components. The function compensates for fluctuations in the coefficient of friction between brake pads and brake discs, for example. With sufficient adhesion between wheel and rail, this results in more stable, less variable braking behavior, making it possible to achieve reproducible stopping distances at all speeds and in all braking modes [5]. The second RBD building block is adhesion management (ADM) for improving and better utilizing wheel-rail contact, especially in adverse conditions. This innovative adhesion management function with situational adaptivity is based on extensive research and development work [4], and currently comprises multiple, intelligently controlled sanding units plus adaptive wheel slide protection. Whenever inadequate adhesion is detected, especially this functional combination of the two functions, sanding and WSP, plays a particularly important role in actively initiating measures to achieve reliably high rates of deceleration.
Using RBD to reduce minimum train headway times
The definition of capacity as currently described by means of blocking times is consistent with current regulations.
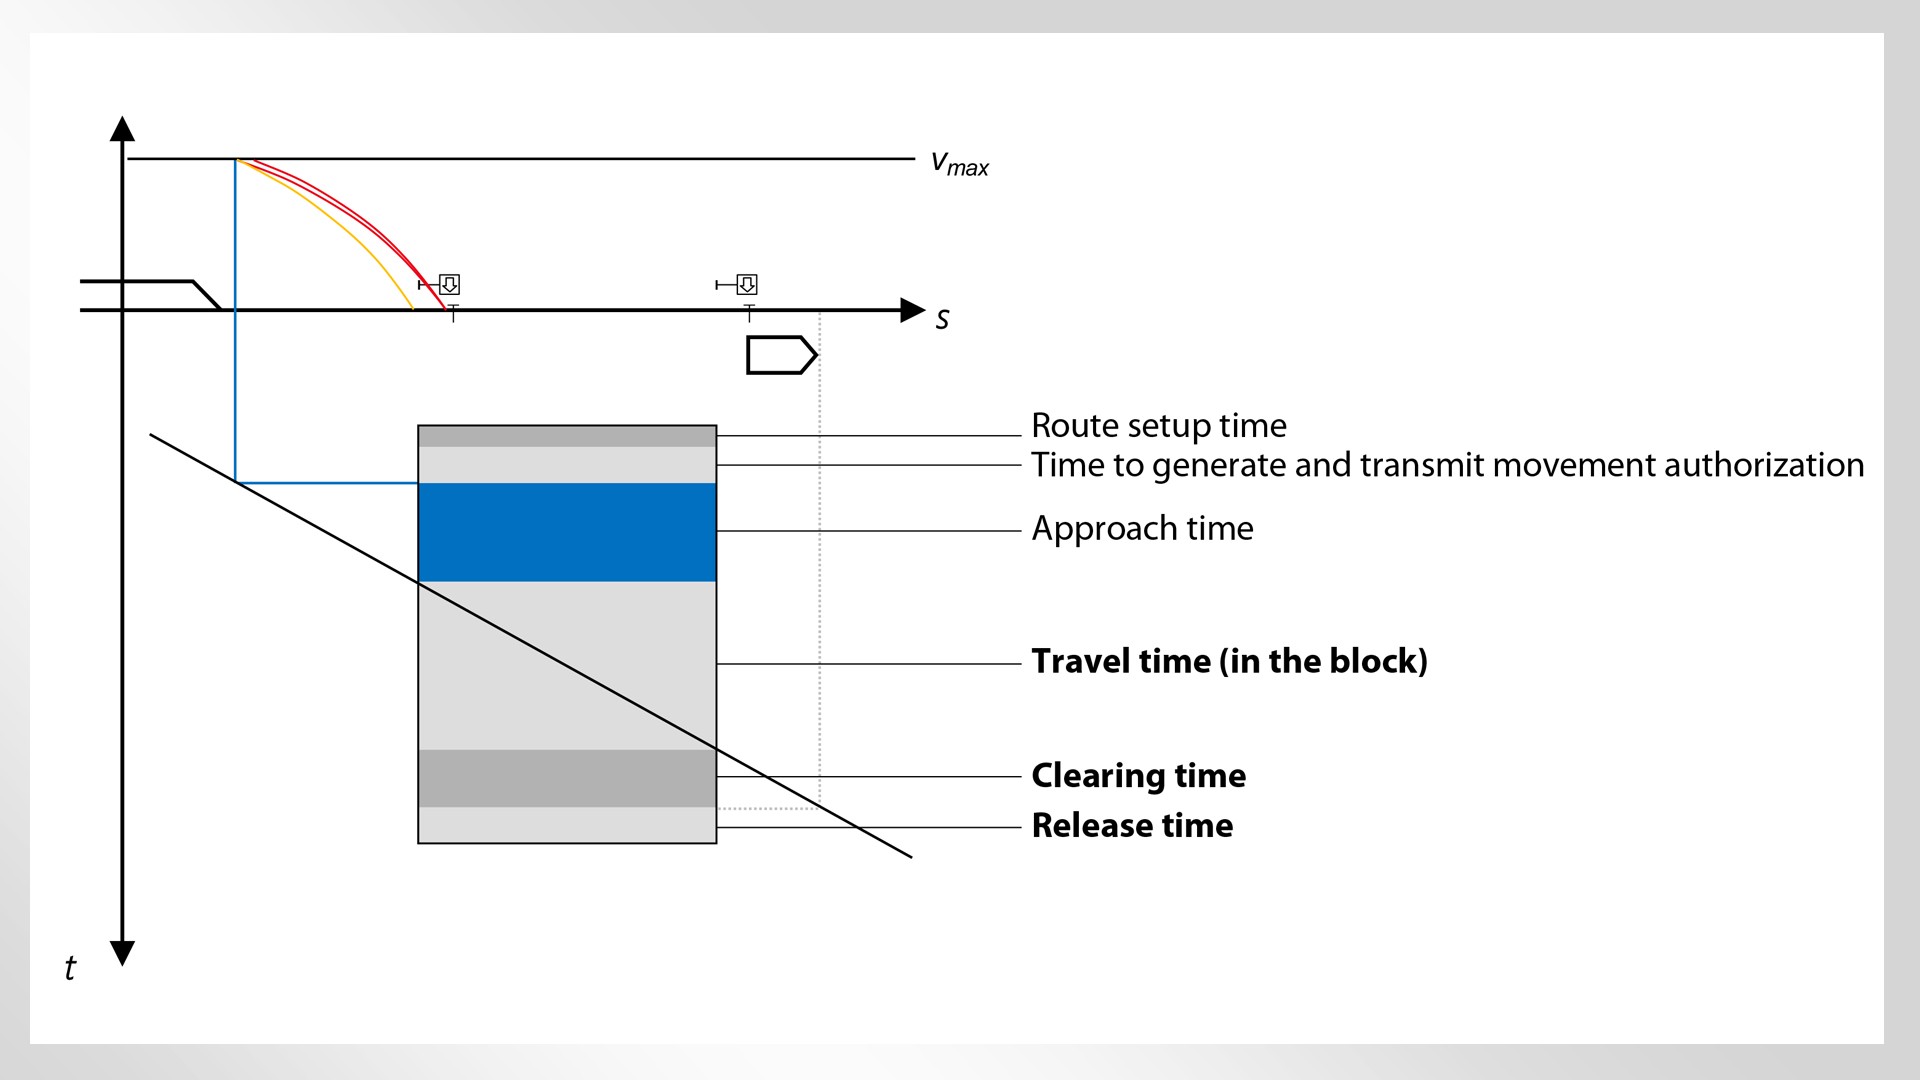
But the blocking-time model must be adapted if the intention is to monitor train journeys via ETCS, where signals are transmitted directly to the driver’s cab, instead of conventional train control systems using main and distant signals. As well as other variables, this particularly affects the approach time blocking-time component, which plays an important role in realizing the benefits of RBD. In the case of conventional signaling, the approach time corresponds to the travel time between the distant and main signal unaffected by other train routes, meaning that the train driver encounters a distant signal indicating “expect travel” within sighting distance. In the case of an ETCS-monitored journey with cab signaling, when the DMI changes to the indication curve (“yellow display”), this corresponds to the unintended detection of a distant signal indicating a restriction. At ETCS Level 2, this DMI color change determines the start of the approach time respectively (Fig. 2). “ATO over ETCS” is intended to reduce the display of different conditions in the DMI and to allow the train to operate closely to the Emergency Brake Intervention (EBI, emergency braking curve). Determining the “ATO reaction curve” in correnspondence to the indication curve is done in a simplified manner by generating a minimum of the emergency braking curve and the service braking curve. When trains are running in ATO, the service braking curve does not necessarily have to be derived from the ETCS curve set, but can be explicitly defined as the ATO target braking curve, resulting in the situation illustrated in Fig. 3. The EBI curve is based on the actual danger point and is protected by the preceding signal. The danger point, also known as the Supervised Location (SvL), is represented by a symbolic axle counter. To avoid enforced emergency braking, ATO does not fully exploit the potential of the EBI curve, but uses an EBI* curve that precedes the actual EBI curve, thus is also based on the danger point.
Quote
RBD is able to increase capacity and prevent loss of punctuality in adverse adhesion conditions.
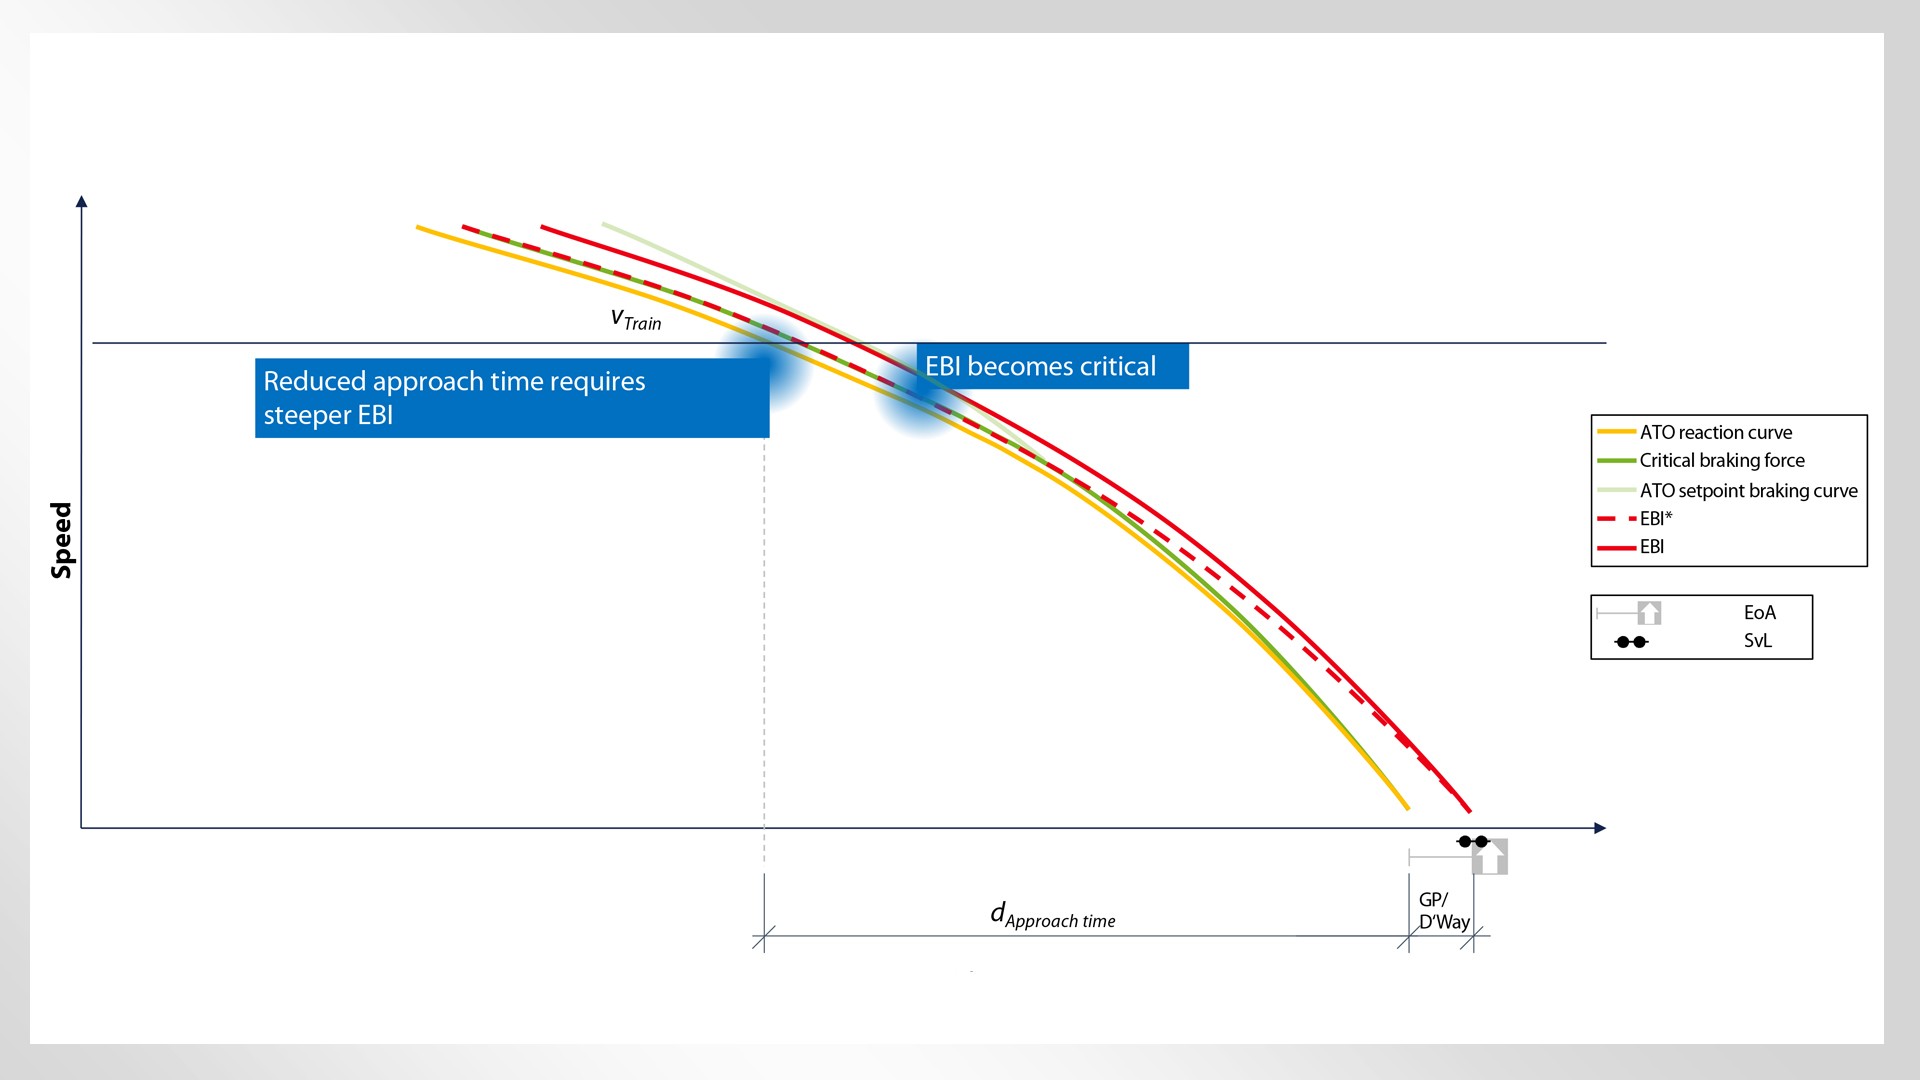
During a free braking operation, ATO follows the ATO target braking curve, which is based on the signal or, in case of a stop, on the stopping location. The main signal, also known as the End of Authority (EoA), is represented in the graphic by an ETCS stop marker. The relevant braking curve is based on a minimum of the generated EBI* curve and the ATO target braking curve. To take account of ATO reaction time/processing time, the ATO reaction curve is derived from and precedes the relevant braking curve. The intersection of the ATO reaction curve with the train’s trajectory defines the very latest point in time at which the vehicle must receive a Movement Authority signal so that braking is not initiated. If the aim is to increase capacity by reducing pre-occupation, it is important to determine which braking curve determines the approach time. Here, a distinction can be made between three different scenarios:
- Scenario 1: The EBI* braking curve is consistently used as the relevant basis for the ATO reaction curve. This may be the case if the SvL is only a short distance from the EoA, or if the EBI curve is substantially flatter than the ATO target braking curve. In such cases, reducing pre-occupation demands a steeper EBI target braking curve.
- Scenario 2: The EBI* braking curve is partially used as the relevant basis for the ATO reaction curve. Fig. 3 illustrates a situation in which the ATO target braking curve and EBI* intersect. In the low-speed range, the ATO target braking curve is still definitive. In the high-speed range, and especially where the train’s trajectory intersects the ATO reaction curve, the EBI* braking curve is more restrictive than the ATO target braking curve, so becomes the definitive basis for pre-occupation. Here, reducing pre-occupation imposes a steeper EBI target braking curve.
- Scenario 3: The ATO target braking curve is consistently used as the relevant basis for the ATO reaction curve. Here, pre-occupation can only be reduced by applying a steeper ATO target braking curve.
It is important to note that the vehicle’s braking characteristics are not the only factors to determine which of these three scenarios apply; infrastructural characteristics also play a role. In particular, large negative gradients (slopes) will influence the calculation of the EBI curve in the braking model, enormously flattening it on downhill stretches to ensure higher level of safety. To intentionally influence the EBI braking curve, and consequently also the ATO braking curve, the vehicle’s braking characteristics must be described using the Gamma model. Whereas the Lambda model uses the conversion model to convert braking characteristics described by brake percentage, brake notch and type of train into the braking decelerations and brake build-up times required for ETCS, the Gamma model makes it possible to directly define braking decelerations depending on a required confidence level. Here, the RBD functions impact the deceleration curve in various ways [6, chapter 3.13.6.2.1.4]. Thus the DCC deceleration control function can be used to influence onboard parameters A_brake_emergency and Kdry relevant for the braking curve definition. DCC makes it possible to compensate for deceleration that is either too low or too high – e.g. due to variance of the pad/ disc coefficient of friction, or wear and tear – and so has an especially high impact on dry-rail braking distances. This in turn guarantees to meet dry-rail braking distances. Increasing Kdry in particular results in a higher A_brake_safe braking deceleration which is then closer to nominal deceleration. The adhesion management functions, on the other hand, aim to improve braking distances in adverse wheel/rail adhesion conditions, hence the Kwet braking curve parameter. If these functions are taken into account in future determination of the safe braking deceleration, this will result in shorter braking distances, in turn improving the the Kwet value.
To increase capacity, ETCS Level 2 can be used to significantly shorten the maximum block length around highly congested nodes. Further shortening of block lengths – theoretically up to and including the moving block concept – would have little additional capacity-enhancing benefit. While the travel time within the block itself would be reduced, the effect on block occupancy time would only be minimal, since all other blocking-time components and their duration would remain unchanged. Compared with the pure travel time within a short block, the approach time component (especially at higher speeds) would generally represent a much greater proportion of the overall time. This is where the systematic improvement of braking characteristics using the RBD approach can help to reduce approach times, especially in an already highly optimized block layout.
Using the example of a closed S-Bahn network to quantify the benefits of RBD
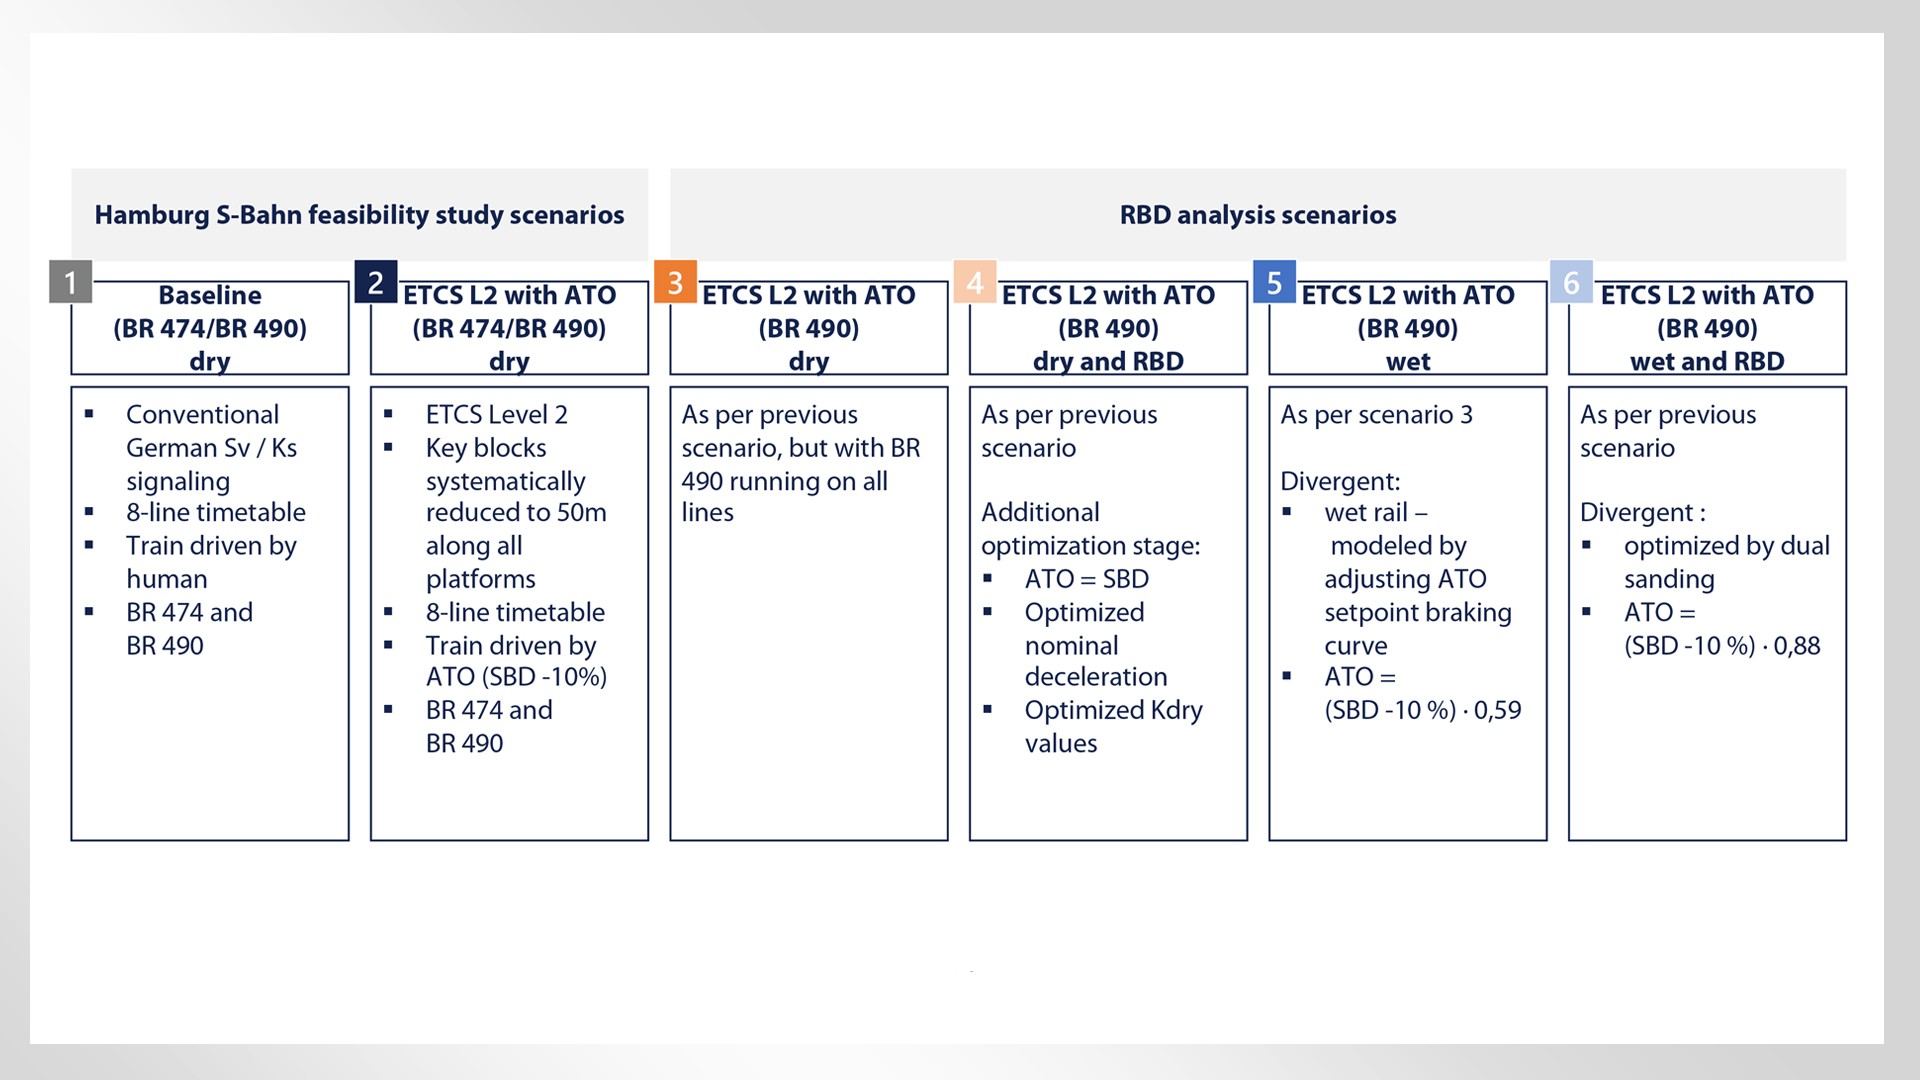
Shortening the approach time further reduces the minimum train headway time, hence the train’s route capacity consumption. The time saving can either be reallocated to additional train routes or used as additional buffer time for improving operational stability (e.g. expressed as punctuality) [3]. This has already been demonstrated in a study under consideration of various generic infrastructures and vehicle types [1]. In a recently completed study, the potential for reducing train headway times by using Knorr-Bremse’s RBD functions was exemplarily demonstrated based on the Hamburg S-Bahn commuter rail network. The study builds on the “Technische Machbarkeitsuntersuchung (MBU) Rollout Digitale S-Bahn Hamburg” (Technical Feasibility Study: Digital S-Bahn Hamburg rollout) [2], thus making it possible to clearly quantify the different factors’ influence on the capacity and stability of rail operations. For this purpose, rail operations management studies were carried out based on the microscopic infrastructure model and the future 8-line timetable planned for the Hamburg S-Bahn. The assessment of the RBD approach in terms of it’s influence on capacity and service quality was performed separately for dry rail and reduced wheel/rail adhesion conditions (henceforth referred to as “wet” rail), as typically found in, for example, autumn (fall) operating conditions. The impact of improved braking performance on pre-occupation was determined on the basis of train headway times. To investigate the effect of improved ATO and ETCS braking curves on service quality, rail operations were simulated considering the entire network. Finally, capacity indicators were calculated based on the results of the train headway determination and the simulations.The first two scenarios are taken from [2] and help to correlate the other scenarios and their characteristics. The first scenario or baseline describes the technical status quo with conventional external signaling and an 8-line timetable. Scenario 2 is the starting point for investigating the RBD approach, because it corresponds to the technical vision developed in the feasibility study. Consequently, Scenario 2 includes a block design optimized for ETCS Level 2 and ATO GoA 2. Scenarios 3 to 6 are primarily used to investigate RBD on dry and “wet” rail. Scenario 3 is a variation on the second scenario, distinguishing itself from the latter only by standardizing on the use of a BR 490 vehicle rather than a mix of BR 474 and 490 vehicles (and thus providing a simplified, future-oriented perspective).
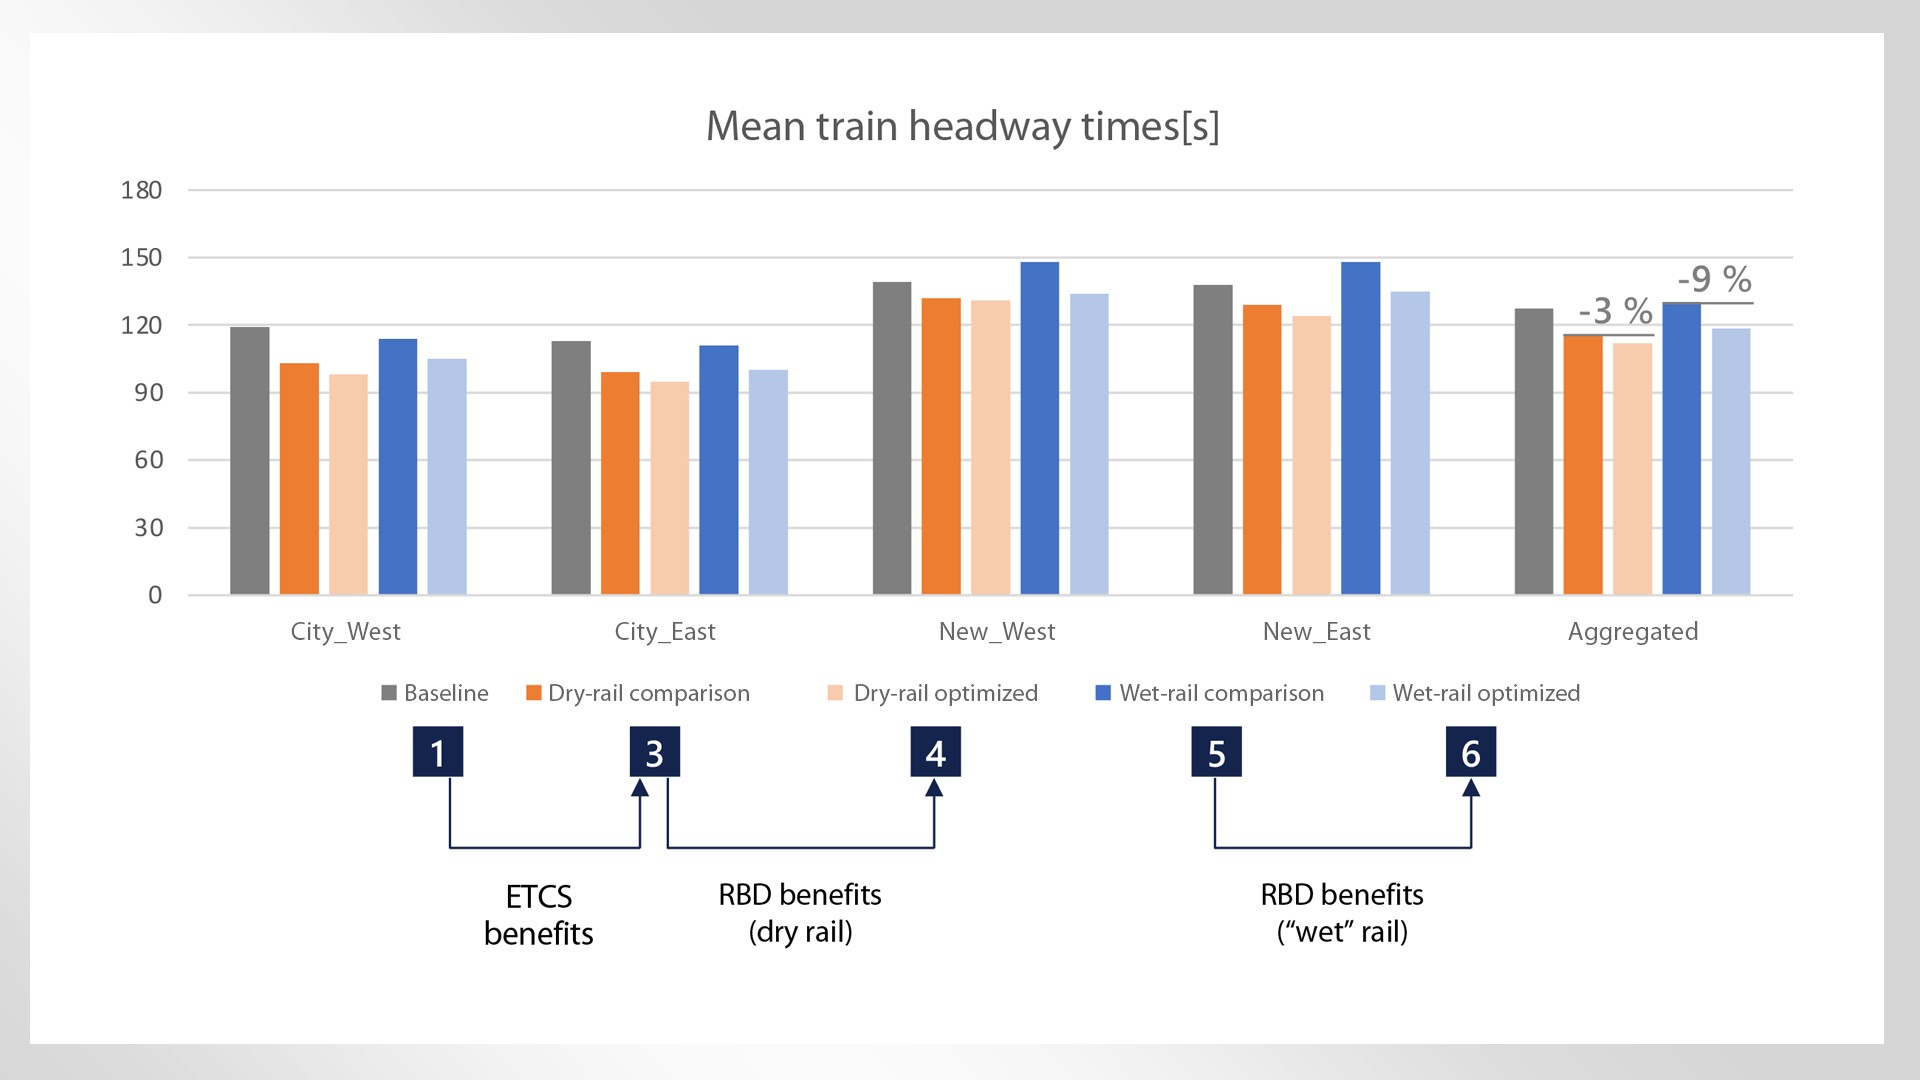
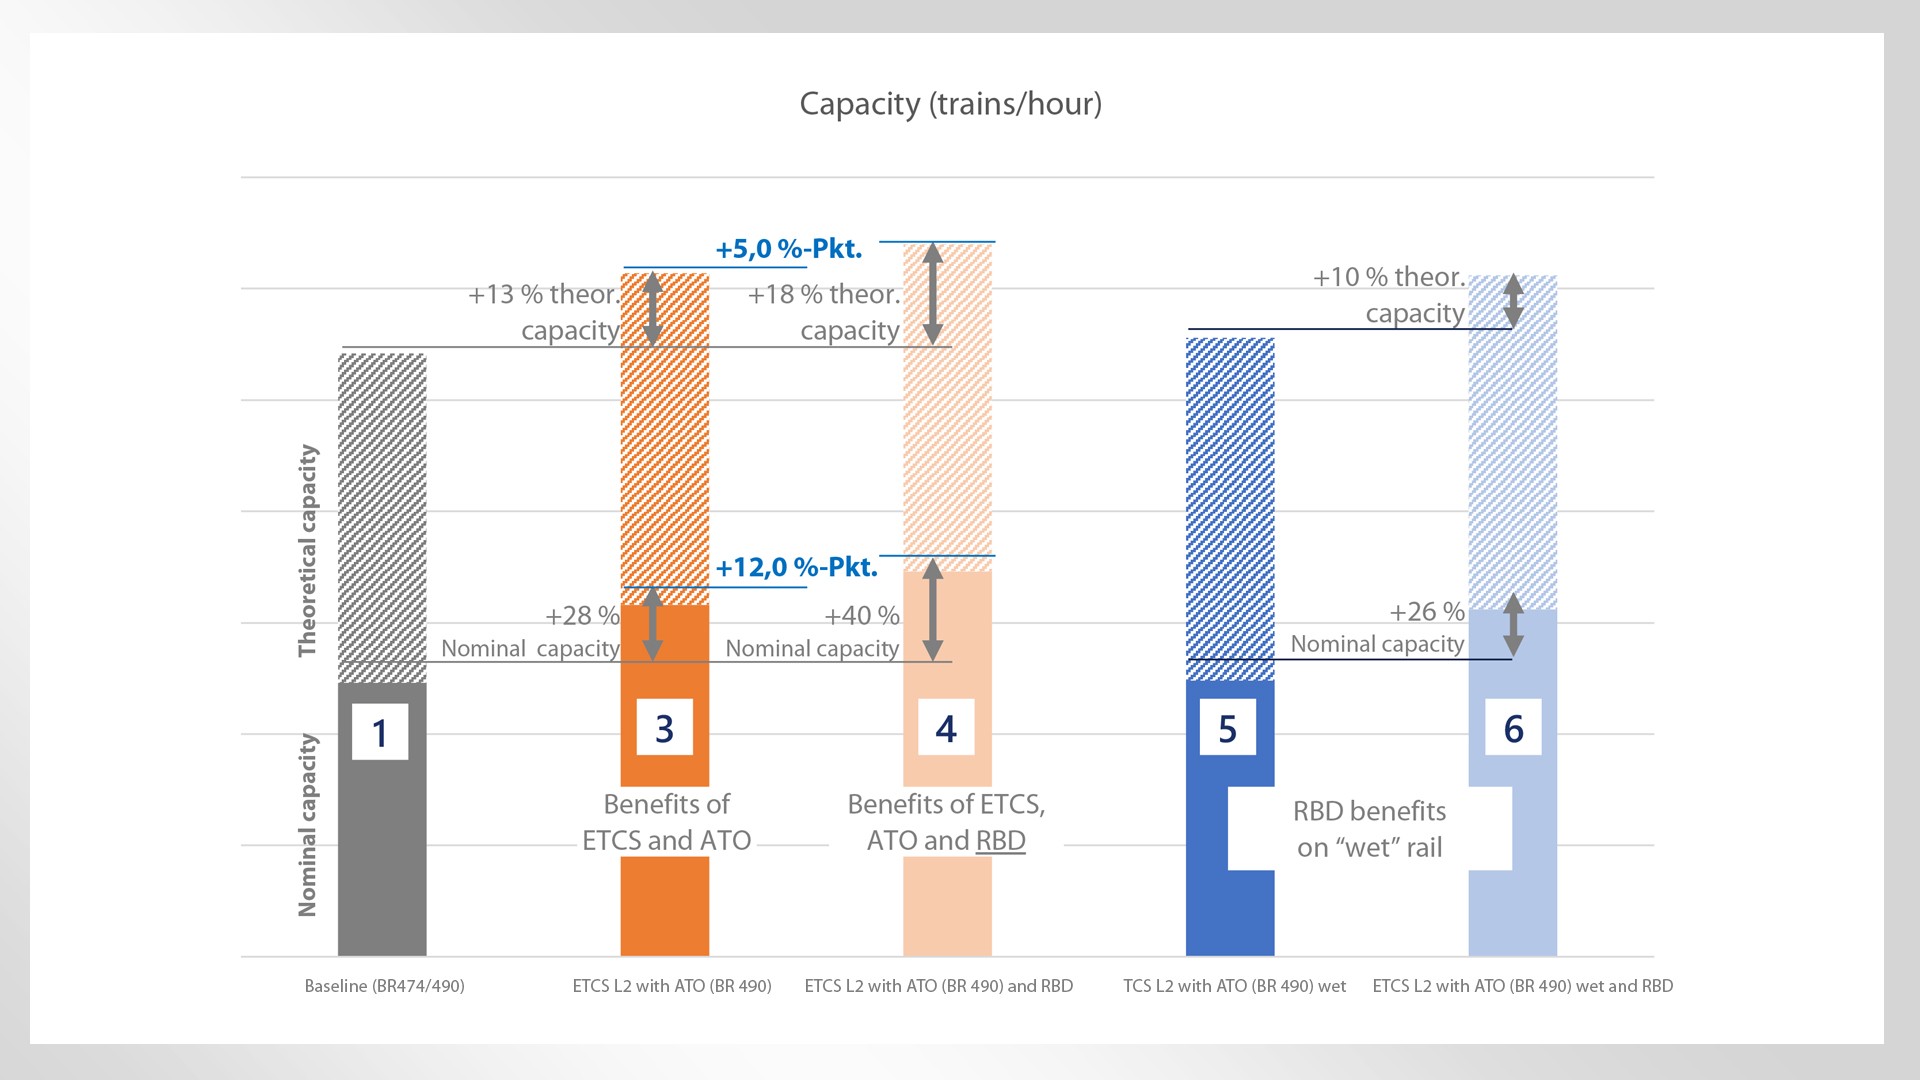
Scenario 4 corresponds to Scenario 3 (dry-rail comparison) but with all trains equipped with RBD functions. Scenarios 5 (wet-rail comparison) and 6 are devoted to “wet” rail, the first being a reference scenario without RBD, the second a variant in which all rail vehicles are fully equipped with RBD functions. Fig. 5 shows the train headway times for each scenario, averaged over the two network segments “City” (both lines between Altona and Hauptbahnhof) and “Neugraben” (branch line between Hauptbahnhof and Neugraben) and broken down by direction of travel, as well as the overall (aggregated) mean values. On average, by introducing ETCS and ATO in both directions of travel on both network segments, headway times can be reduced by 9%. By equipping the complete fleet with the RBD functions, headway times can be reduced by a further 3% on average. On “wet” rail, equipping trains with RBD functions can reduce headway times by another 9% on average. In the simulation of operating conditions on dry rail across the network as a whole, the higher train frequency made possible by shorter headway times resulted in an 18% reduction in uncompensated delays and improved three-minute punctuality by one percentage point. Both these findings are based on a comparison of two scenarios featuring ETCS Level 2 and ATO and running BR 490 multiple units exclusively, with and without the use of RBD. On “wet” rail, an equivalent analysis found that uncompensated delays were reduced by 57%, so by more than half. By using RBD, three-minute punctuality could be increased by seven percentage points – i.e. raised to a level similar to dry rail – compared with vehicles operating on “wet” rail without RBD. RBD is therefore able to prevent punctuality losses in adverse wheel/rail adhesion conditions (“wet” rail). Fig. 6 is a combined illustration showing nominal capacity and theoretical capacity. Theoretical capacity is calculated directly from the measured train headway times, and represents the maximum technically possible but operationally unfeasible capacity. Even so, it serves as a useful parameter for drawing qualitative comparisons between scenarios. The nominal capacity is determined in accordance with Deutsche Bahn’s Regulation Ril 405 [7] and as well as train headway times, takes account of levels of delay (based on operational simulations) and permissible knock-on delays at commercially optimal operational quality. Where the BR 490 multiple unit is used exclusively, ETCS and ATO can improve the mean theoretical capacity by 13% compared with the baseline (Scenario 1). Using RBD, it is possible to increase mean theoretical capacity by another five percentage points and nominal capacity by 12 percentage points compared with Scenario 3. If, rather than assessing RBD against the baseline, it is instead compared with the ETCS and ATO scenario without RBD (the new baseline Scenario 3), theoretical capacity increases by 4.2% and nominal capacity by 9.5%. As already described above, nominal capacity increases disproportionately to theoretical capacity, since the improvement in operational quality due to RBD has an additional capacity-boosting effect. As there is no corresponding baseline for “wet” rail, the “ATO and ETCS without RBD” scenario (Scenario 5) was used for purposes of comparison. Using RBD, the mean theoretical capacity on “wet” rail can be increased by 10% and nominal capacity by 26% compared to the “without RBD” scenario. The significant benefits of RBD are reflected by the fact that capacity on “wet” rail is practically identical to capacity on dry rail, meaning that rail operations can become less weather-dependent if the targets set for RBD technology can technologically be realized.
Conclusion
In view of the growing demand for capacity, the introduction of cab signaling (e.g. as ETCS Level 2) offers an opportunity to significantly reduce train headway times by means of block length reduction. However, once a certain “minimum block length” has been achieved, further attempts to shorten blocks – in extreme cases, by introducing moving blocks – will no longer have a positive impact on headway times. To further reduce train headway times despite reaching “minimum block lengths”, the onboard RBD approach examined in this study is a suitable way using its benefits of reduced braking-distance variance and reliably achieved reproducible braking distances. If this RBD approach was taken into account when optimizing EBI and ATO braking curves, this would have a direct positive impact on approach times and hence minimum headway times.
Authors: Kerstin Büker MSc (quattron management consulting GmbH / VIA Consulting & Development GmbH), Dr. Marcus Fischer (Knorr-Bremse SfS), Johannes Gräber MSc (Knorr-Bremse SfS)
References:
[1] E. Hohmann, M. Englbrecht, H. Gremmel, T. Linke, “Höhere Transportkapazitäten auf der Schiene: Simulation zeigt Potenziale für optimierte Auslastung bestehender Infrastruktur” (Improving rail transportation capacity: Simulation shows potential for optimizing the utilization of existing infrastructure), ZEVRail, 2020 (Vol. 144) issue 08.
[2] Engineering Consortium, “Technische Machbarkeitsuntersuchung Rollout Digitale S-Bahn Hamburg” (Technical Feasibility Study: Digital S-Bahn Hamburg rollout), final report, November 21, 2021. [Online]. Available at: https://suche.transparenz.hamburg.de/dataset/abschlussbericht-technische-machbarkeitsuntersuchung-mbu-rollout-digitale-s-bahn-hamburg. [Accessed on 05.08.2022].
[3] P. Bührsch, T. Büker, S. Schotten, S. Hardel, “Vorteile und Nutzen von ETCS L2oS und DSTW im Schienenverkehr” (Advantages and benefits of ETCS L2oS and DSTW in rail transportation), Eisenbahn Ingenieur Kompendium. Jahrbuch für Schienenverkehr & Technik 2022, pp. 223-238.
[4] M. Fischer, K. Haselsteiner, F. Szekely, S. Heinz, F, Kröger, “Mehr Mobilität auf der Schiene: Erhöhung der Transportkapazität durch Optimierung des Kraftschlusses” (More mobility by rail: Boosting transportation capacity by optimizing adhesion performance), ZEVRail, 2020 (Vol. 144) issue 10.
[5] N. Kreisel, U. Friesen, R. Furtwängler, J. Braeseke, D. Ciesielski, “Verzögerungsgeregeltes Fahrzeug ermöglicht ein stabileres Bremsverhalten in allen Geschwindigkeiten” (Deceleration-controlled vehicle enables a more stable braking behavior in all speeds), ZEVRail, 2020 (Vol. 144) issue 01/02.
[6] UNISIG SUBSET-026-3, System Requirements Specification, Chapter 3, Principles, Issue 3.6.0, 10.05.2016.
[7] Regulation 405: Track capacity. Valid from 13.02.2009.